As CEOs worldwide are looking at marketing as a growth driver, they have become more critical in measuring all marketing efforts’ performance.
What do CEOs want most from their B2B marketing team? Clarity. They want to see results that clearly show their company’s marketing efforts are working and increasing ROI.
CEOs expect to hold their marketing leaders accountable for reaching or surpassing their numbers, just like their sales leaders.
CEOs can get frustrated when the only metrics they receive from lead marketers include ambiguous brand data, activity reports, and engagement reports. They want their metrics to be tied directly to revenue. Essentially, they’re looking for quantifiable answers to these questions:
- What, or when, is the return of investment (ROI)?
- How much is marketing contributing to revenue?
As a CMO or director of digital marketing, you can use a handful of B2B marketing metrics to answer them.
Quick Takeaways:
- ROI and customer acquisition cost are two of the top metrics B2B marketing executives want to see most.
- Knowing which metrics to focus on will help you execute, track, and analyze your marketing initiatives strategically and with confidence.
- Reporting on big-picture KPIs will offer your executives more clarity and give them faith in your marketing efforts.
The end goal of marketing remains consistent even if the processes are continually evolving – generate leads, boost conversion rates, and increase sales pipelines in the shortest time and most cost-effective manner.
Here are some foundational marketing metrics – key performance indicators (KPIs) used to measure marketing projects’ effectiveness.
Why Are B2B Marketing Metrics Important?
For many B2B organizations, Marketing sprung up from a need to hire people to manage events and create brochures. Marketing was treated more like an in-house agency of creative people who did stuff for sales.
As B2B marketing matured into brand, paid media, demand generation, marketing operations, digital marketing and content marketing roles, the need for metrics and KPIs became much more important. Not only do CEOs expect clarity from Marketing. CFOs also expect Marketing to justify our budgets. Marketing is becoming a strategic asset for many B2B organizations
And while advertising, branding and sport sponsorships get the bulk of marketing budgets in some large B2B organizations, it’s those of us in the trenches of content, digital and demand gen marketing who really have to fight for every dollar.
Measurement is the best way to help justify budgets. But it’s also the best way to measure what works and to improve on the marketing outcomes we are trying to achieve: primarily increased sales revenue!
The Most Important Metrics in B2B Marketing
According to a recent survey conducted by DemandGen Report, the most desired metrics B2B marketing executives want to see moving forward include:
- ROI by channel
- Deeper account-based marketing metrics
- ROI by content influence
- Cost of customer acquisition
- Closed-won deal analysis
40% of marketers believe they should improve their ability to measure and analyze marketing performance. Due to a desire to prove how marketing efforts impact a business’s pipeline and revenue and gain insights on buyer interests, 82% of marketers plan to prioritize enhancing their reporting abilities.

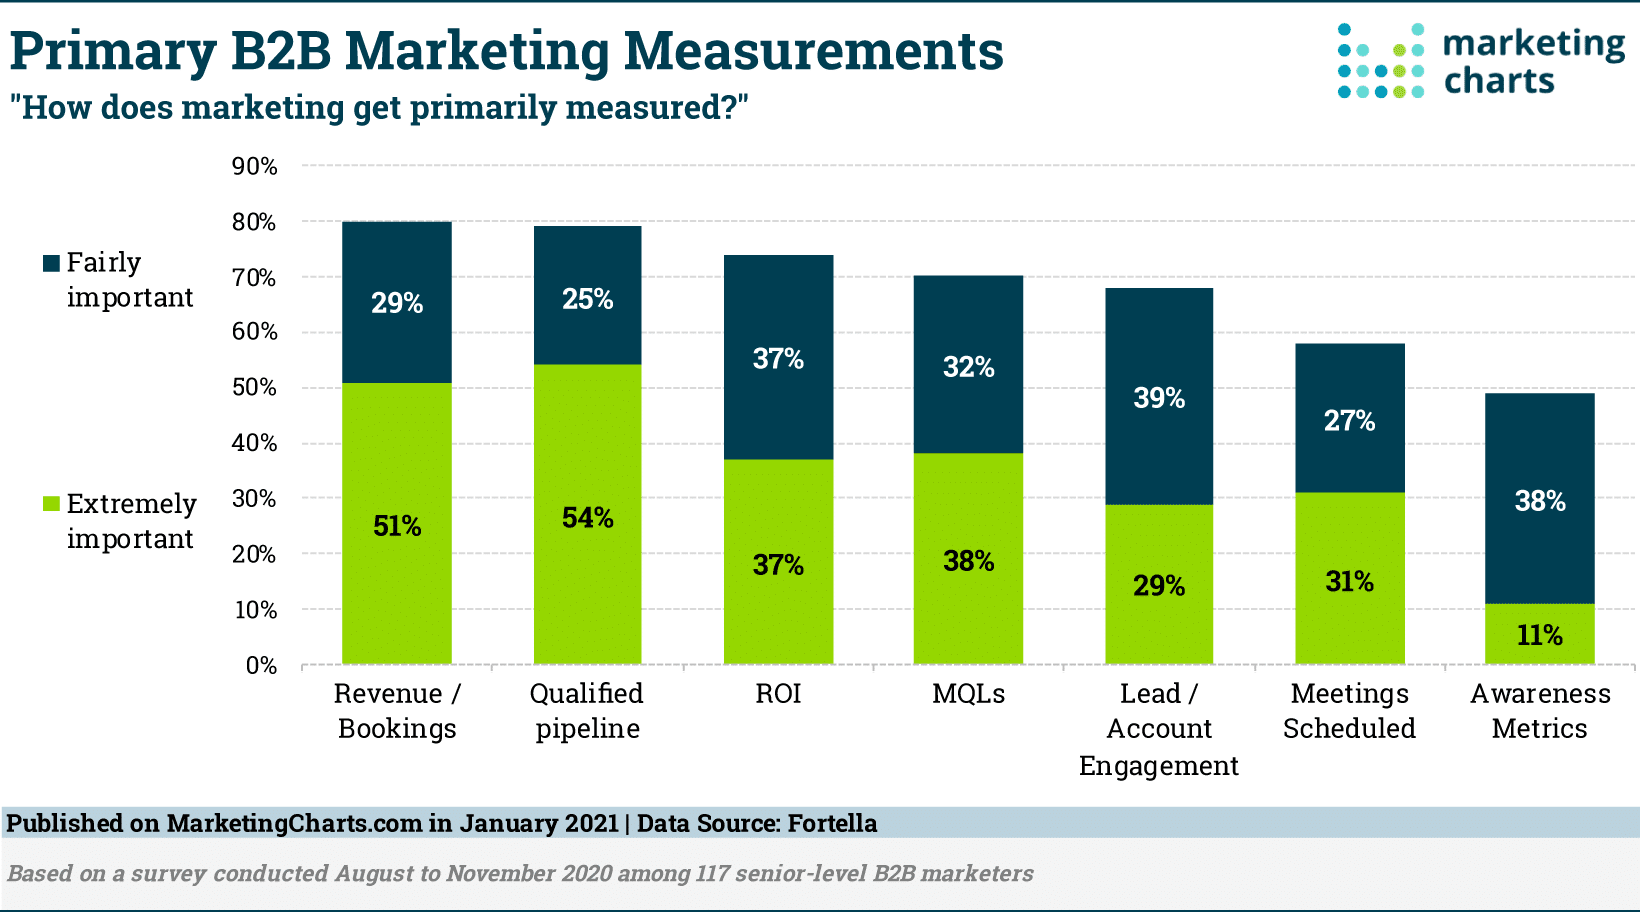
According to Fortella, 80% of B2B marketers measure their performance using revenue, followed closely by pipeline (79%), ROI (74%), MQLs (70%), Leads (68%) and Booked Sales Meetings (58%). Only 49% used awareness metrics to measure the effectiveness of marketing activities.
Models of Measuring B2B Marketing Metrics
During my time at SAP, we followed the 5 V’s Model of Marketing Measurement:
- Volume: How many MQLs, SQLs, SALs and new customers did we convert?
- Value: what is the pipeline value of those leads and new deals. In some cases we also measured “pipeline influenced” as a shortcut to multi-touch marketing attribution.
- Velocity: how much time does it take our leads to move from qualified to accepted to closed?
- Variety: Are we getting leads for all the right segments (country, region, large vs small and industry)?
- Viscosity: How well did leads convert or which marketing programs had the highest conversion rates?
In some ways, all the metrics below can fall into the 5 V model. But these are mostly internal marketing metrics that helped us determine what was working and how we were doing.
But What Figures Do CEOs Want?
Smart CEOs want to know simple answers like: How much revenue did you bring us? Is it recurring? What was the cost of acquiring that revenue?
What you won’t find on this list:
- Website traffic
- Emails sent
- Social media “engagement” (mentions, likes)
- Eyeballs
- Clicks
Why?
Every CEO cares about revenue from new customers and the lifetime value of a customer (LTV) those new customer bring, along with their acquisition cost (CAC). But that’s not all you should include in your marketing reports to prove the success of your efforts.
Here are the most important marketing metrics for CEOs. Tracking and analyzing these marketing KPIs will give you a competitive edge and clarify the effectiveness of your marketing campaigns. That way, your CEO will have no doubts about the value of your team’s contributions.
Qualified Lead Rate
Leads are businesses with an interest in your services or products, which have the potential to be paying clients.
Qualified leads are businesses that replied to your marketing campaign via phone, email, or social media response, comment, or inquiry.
The formula for calculating the qualified lead rate is:
Qualified Lead Rate = (Qualified Leads / Total Leads) x 100
Personalize your connection with your leads through phone calls or face-to-face meetings. Do not rely solely on cold calling or marketing email blasts.
Cost Per Lead (CPL)
The CPL gives a dollar value to acquiring new leads. Marketers use it in businesses with high-value products or subscription services.
The formula for calculating CPL is:
Cost Per Lead = Total Ad Spend / Total Attributed Leads
Base your target CPL on business goals and not on fixed percentages. Choosing the right target CPL helps you assess your marketing projects, prioritize efforts, and spend your marketing budget on ones that align with your business goals.
Website Traffic
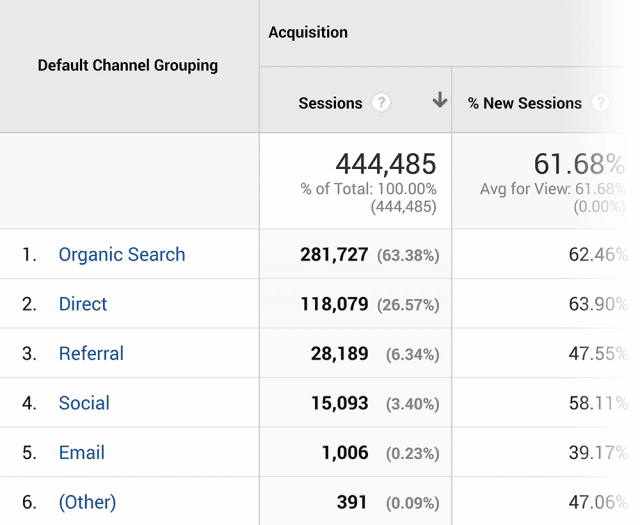
Analyze your website’s traffic (through tools like Google Analytics) to help measure your marketing performance. Low traffic can indicate a website technical problem, a Google algorithm penalty, or broken links.

When more people click on your site, you develop brand authority and become trustworthy to clients. You also grow organic traffic, which is free.
The marketing metrics above help your marketing team focus on the right projects and troubleshoot problematic marketing processes. However, your CEO will zero in on results and costs, not only on intermediary processes.
Here are essential marketing metrics that you should include in your dashboard for quantifying revenue and ROI that you will want to discuss with your CEO:
Lead Velocity Rate (LVR)
The LVR calculates your pipeline development and measures the qualified leads’ month-to-month growth percentage.
To calculate LVR:
Lead Velocity Rate = (Qualified Leads Current Month – Qualified Leads Last Month) / Qualified Leads Last Month X 100
- Tracking LVR gives you a real-time growth indicator of growth since you can generate more qualified leads if you observe that you are lagging for the month.
- The LVR metric becomes unreliable when problems in the sales process arise since LVR is not revenue.
Marketing Influenced Customer Percentage
This metric will show you what percentage of new customers were influenced by your marketing efforts. To calculate this ratio, take the total number of new customers who interacted with a marketing activity and divide it by the number of new customers you signed up within the same period.
Questions to Answer
- How are your marketing investments impacting sales productivity?
- What’s the impact on your company’s sales pipeline?
- How are your efforts impacting revenue velocity?
Marketing Originated Customer Percentage
Show your CEO what percentage of new business marketing is driving. To calculate this ratio, take the number of new customers you signed up in a specific period. Then figure out what percentage of them started as a marketing-generated lead. This measurement is much easier to track if you have a closed-loop marketing analytics system.
Questions to Answer
- What percentage of your customers are marketing-generated?
- How much of your revenue can you attribute to sales leads coming from demand generation efforts or account-based marketing over a given period?
- How many customers started as marketing-qualified leads?
Customer Acquisition Cost (CAC)
The CAC looks at how much it costs to convert a lead into a customer. Calculating and monitoring CAC is crucial, if not more essential than determining the CPL.
Use this formula to calculate CAC:
Customer Acquisition Cost = Sales and Marketing Cost / New Customers
- Perform A/B split testing of new checkout systems and set up Google Analytics goals to improve website performance, site speed, landing page, and mobile optimization.
- Implement an effective customer relationship management (CRM) process to improve customer satisfaction. Address your clients’ inquiries smarter and quicker on all contact points.
Questions to Answer
- What is the average cost of gaining a new customer?
- What is the total cost of your demand generation efforts or lead account-based marketing during a specific period? Include compensation for your entire marketing team and expenses for vendors, marketing technology, and other materials.
Marketing Percentage of CAC (M%-CAC)
To calculate the marketing percentage of your customer acquisition cost, take your total marketing spend for a specific period. Then divide it by the number of new customers you generated within that time.
The lower the number, the better. If you have a high marketing CAC, your marketing team may be spending too much, or your sales team may be underperforming.
Questions to Answer
- What is your marketing team’s impact on CAC?
- Are there improvements your team can make to lower this number?
Return on Marketing Investment (ROMI)
The ROMI metric calculates a marketing campaign’s revenue compared to the cost of executing that marketing campaign. ROMI or just ROI (Return on Investment) will help you determine how much you’re spending on marketing compared to the amount of revenue you’re generating. You can use this metric to measure your revenue for individual campaigns. It helps identify marketing projects that generate revenue or lack traction.
The formula for calculating ROMI is:
ROMI = (Marketing Income – Cost of Goods – Marketing Expenditures) / Marketing Expenditures) x 100
- Your marketing investments are not generating revenues if your ROMI is less than 100%. They are profitable if ROMI is more than 100%.
- Use ROMI carefully in deciding which marketing tactics to boost, retain, or remove. Do not immediately cancel low-performing marketing projects that may need adjustments to be successful.
Questions to Answer
- What’s your ROMI?
- How much are you spending on marketing? What are you generating in return?
- Are your campaigns contributing to company growth?
- Are you recouping the money and time spent to develop and execute your marketing campaigns?
Time to Revenue
Time to revenue measures the length of time from when a contract is executed until a purchase is made or a deal is closed.
Questions to Answer
- How has the marketing team helped shorten time to revenue?
- What has marketing done to decrease the combined expense-to-revenue ratio of sales and marketing activities?
Average Revenue Per Account (ARPA)
The ARPA metric measures per account revenue and have two types: new and existing. ARPA is essential if you want an exact average income, especially when you change the pricing.
The formula for calculating ARPA is:
Average Revenue Per Account = Total Monthly Recurring Revenue / Total Accounts
- The ARPA helps reveal trends in account contraction and expansion, assess pricing plans, and identify how ARPA is changing.
- The ARPA changes depending on your pricing and product. Check internal benchmarks like last year’s ARPA for comparison.
Time to Payback CAC
The Time to Payback CAC refers to the period it takes to earn back the CAC and identifies your break-even point.
The formula for calculating Time to Payback CAC is:
# of Months to Recover CAC = CAC / (ARPA x Gross Margin)
- Time to Payback CAC helps you measure capital efficiency and identify the cash amount you need before turning in a profit.
- A company will be more profitable with a shorter payback period. Reduce the time to payback CAC to lower the lost CAC from churned customers.
Gross Monthly Recurring Revenue (MRR) Churn Rate
Gross MRR Churn Rate is the total revenue loss percentage due to downgrades or cancellations. It is inversely proportional to the Gross MRR Retention Rate, which is the monthly retained revenue.
The formula for calculating Gross MRR Churn Rate is:
Gross MRR Churn Rate = (Total MRR Churn this month / Total MRR at the start of this month) x 100
- The churn reflects customer targeting and increasing product value.
- Monitor gross churn to see the exact lost revenue, accurately identify if it is attracting the right customers and if the product or service has a high value.
Customer Lifetime Value (CLTV)
CLTV can help you predict how much a customer will spend on your products or services throughout their lifetime. Calculating this number will help you understand how much you should pay to acquire new customers and retain current ones.
The formula for CLTV is:
Customer Lifetime Value = Average Revenue Per Account / Customer Churn Rate
- CLTV is useful for planning future expansion, but this metric can fluctuate. The estimated CLTV will vary month-to-month for businesses with a small sample size.
- Implementation of new features or an increase in churning rate has an impact on CLTV value.
Another way to calculate LTV is by taking the average value of a purchase times the number of times the average customer buys from you in a year times the average length (in years) of a customer relationship.
Questions to Answer
- How much do you spend to acquire a new customer in a profitable relationship?
- Which products or services are the most profitable?
- What’s your most profitable buyer persona?
Ratio of Lifetime Value to CAC (LTV:CAC)
After you know your LTV and CAC, you can calculate this ratio. A higher ratio indicates a higher ROI. However, if your ratio is too high, you may want to consider spending more on your sales and marketing efforts. 3:1 and 4:1 are good benchmarks to shoot for.
Questions to Answer
- Are you spending too much to acquire each customer (the ratio is less than 3:1)?
- Are you missing out on opportunities by not spending enough?
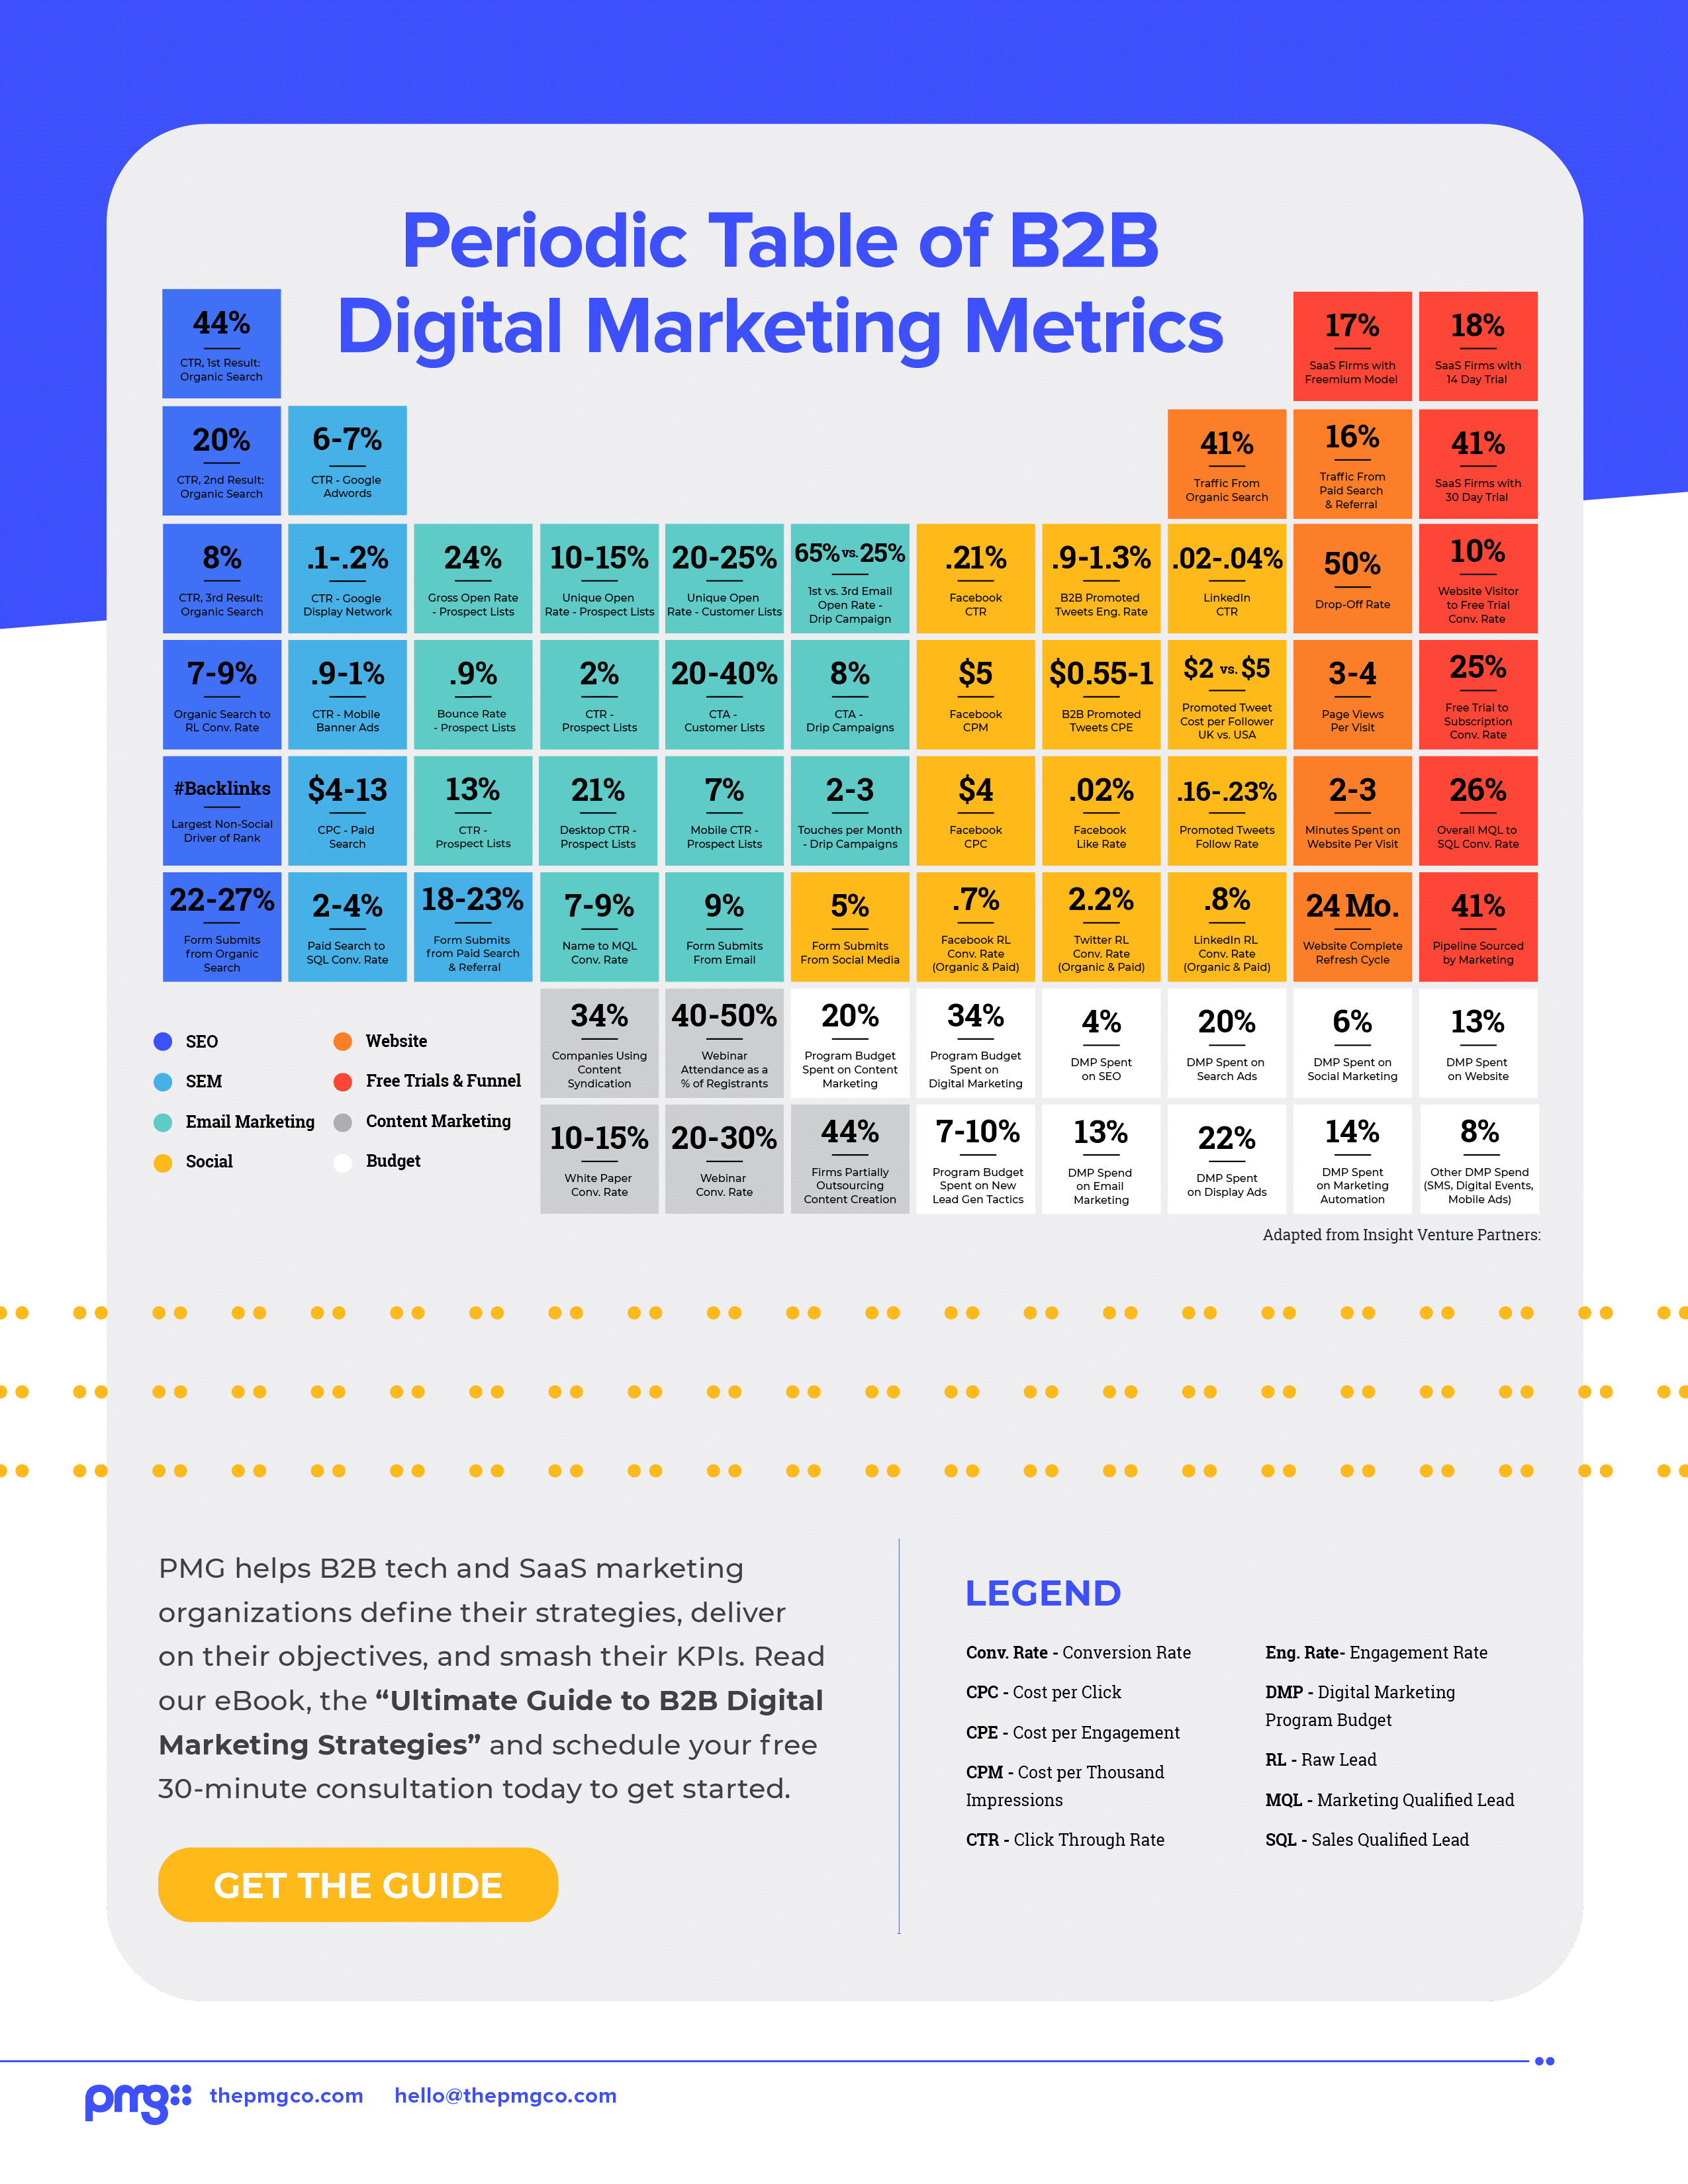
For a more detailed list of B2B Marketing Metrics, check out this periodic table of marketing metrics by pmg which goes into a little more detail and provides some benchmarks.

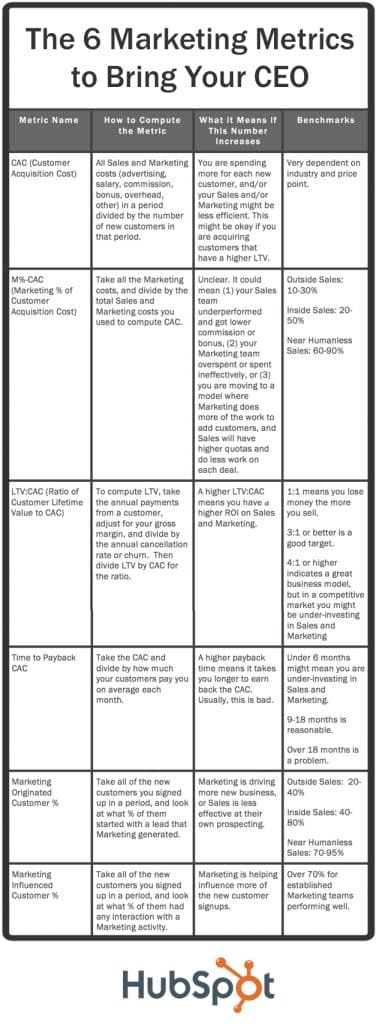
And here is a cheat sheet from Hubspot to help with the metrics we described:

Content Marketing for Improved B2B Marketing Results
B2B buyers look at their vendors as partners in business growth and not just service providers.
Encourage your clients to share your business partnership experiences on peer-to-peer platforms to harness industry influencers’ power.
Moreover, come up with high-impact thought leadership and content marketing strategies, and create regular authority website content to help convert leads to sales, strengthen customer relations, and drive revenues.
If you need help creating top-notch content that will help you get the results your CEO wants to see, Marketing Insider Group would love to help. We’ll create targeted content your customers seek to bring more traffic to your website and help you win new customers. We can also help you calculate and measure ROI and other important metrics.
0 Commentaires