At first glance, the phrase “data storytelling” seems like an oxymoron. It conjures up images of the iconic Star Trek android (or his equally logical predecessor, Mr. Spock) sitting in a garret, weeping over a computer as he fashions the ending for his latest novel.
Sure, your numbers people won’t be likely to suggest a thrilling hero’s journey story to market your company’s latest widget. However, your content marketing teams can use the data they generate to come up with a genius brand story.
It’s not just your internal analytics and customer data you can use to dream up a successful marketing campaign. Combine them with the numbers your subject matter experts generate, and you’ll have a wealth of storytelling material that can fuel your content with the punch only definitive proof can give.
Quick Takeaways:
- Data storytelling reaches both emotion-driven and reason-driven audiences.
- Use internally generated data, along with external data, to support your conclusions.
- Scatter visuals throughout your content to maintain interest and maximize retention.
- Support your conclusion with a rational argument as well as data.
Data Storytelling Captures Both the Emotional and Rational Spheres
I can see your reaction now. “But haven’t you always preached that your audience’s hearts, not their heads, drive buying decisions?” True enough.
After all, statistics show that the emotional portion of the human brain processes information in 1/5 the time that the rational sphere requires.
Other studies reveal similar results, such as the oft-cited Nielsen study, which showed that ads targeting an audience’s emotions triggered a 23% boost in the product’s sales.
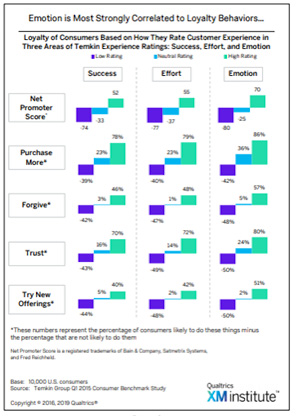
And don’t forget the Qualtrics (originally Temkin) study. It showed that emotion motivates 80% of consumers to trust a brand and 86% of them to make a purchase.

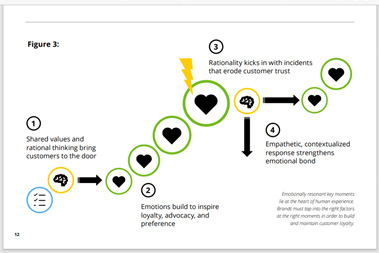
Yet while an emotional connection with your prospects and customers is essential, so is the data behind your conclusions. At the top of the sales funnel, a recent Deloitte study shows, “rational considerations…dominate.”

Apparently, prospects use data and reason to eliminate brands for consideration. For that reason, it pays to weave an emotional story around data, showing a logical relationship between your numbers and your conclusion.
It’s the best of both worlds.
So, What Kinds of Data Should We Use to Make Our Case?
Internal Data
Of course, you should start with your own analytics and customer data. These data, including your social media and content analytics, give you a picture of the prospects and customers you’re trying to reach.
But don’t stop there. Whatever your product or service, you’ll likely have subject matter experts that have done extensive research and testing on their own work, such as:
- Engineers
- Developers
- Lawyers
- Healthcare providers
- Researchers
Additionally, you might consider extending your reach into your target customer base to gather even more data. Customer surveys, along with reports from your sales and customer support teams, can provide valuable insights into your customers’ thought processes.
Don’t forget to gather data from in-person conversations, emails, and social media chats. Often, these one-on-one interactions give you a glimpse into your customers’ and prospects’ thoughts more than anything else.
Using internal data gives you an edge over the competition since it yields unique insights that only you can provide. If those insights represent a breakthrough development in your industry, using them in a compelling story can propel your brand into thought leadership territory.
External Data
While original research – and the data it yields – is a critical source of information, it helps to have data that support your conclusion. Search out well-documented publications that cover the topics you want to write about to find the evidence you need to prove your case. These sources could include:
- Academic papers
- Government publications
- Research firms’ publications
- White papers
- Industry organizations
- Well-researched news stories
- Well-researched books, films, and videos
- Quotes from interviews with industry experts
Be sure to include links to your sources so that your audience can read the information for themselves. Usually, people considering a major purchase will want to see the reasoning behind the conclusions your sources make.
As in all forms of communication that attempt to persuade another person to take action, use original sources as much as possible. It might take a little extra time, but it is well worth the effort in building audience trust.
Use Rational Arguments to Connect the Dots
As a content marketer, you’re used to emphasizing the emotional side of content creation. Sure, you cite statistics here and there, but your usual goal is to identify your audience’s pain points and create content that helps them conquer those challenges.
Fair enough, but often we neglect the rational side. Although the Captain Kirks and Dr. McCoys among us follow their hearts, some of the decision-makers we need to convince actually think more like Data or Mr. Spock.
But data alone won’t convince them. You need to connect the dots to show them that there’s a rational basis for your conclusion.
After all, if you go back to your Introductory Logic class in college, the “appeal to emotion” is an informal fallacy. Unless there is a rational argument that undergirds your content, these people won’t buy it.
So, if you haven’t done so lately, review your old Logic 101 textbook to make sure that your data storytelling makes arguments that are both valid and sound.
If you sold yours back to the bookstore for pizza money ten years ago, the University of Minnesota has a great open-source textbook, Introduction to Logic and Critical Thinking, available on its website for instant download.
Connect the dots in a way that both touches your audience’s heartstrings and proves your case with an airtight argument. Doing so will reach both the emotional and logical segments of your audience.
Now, Blend Your Data and Storytelling Skills for a Killer Brand Story
As MIT Sloan’s Beth Stackpole points out, it’s simply not enough to pull some data, create some visuals, and slap them onto your blog posts. Start by searching the data for a story.
What do the numbers tell you? How can this information help your prospects and customers solve the kinds of problems that keep them up at night?
Organizing the data with a focus on your target customer can give you an idea of how you can construct a story around the information. For example, suppose that your engineers test out your new widget’s performance against 2 of their competitors.
Their research determines that your company’s widget boosts the efficiency of a machine often used in your customers’ industry by almost 2 to 1 over one of your competitors and by 50% over the other.
Doesn’t that suggest the perfect hero’s journey story to you?
Your customer struggles to keep up with the demand for her products. Oh, but if only she could increase her machines’ efficiency!
She searches high and low – and then, voila! She discovers a piece of content that explains that data in plain English, with visuals that illustrate your points and entertain her enough to keep her hooked until the very end.
Not only is its conclusion supported by third-party data, but there are also case studies that demonstrate how your widget’s performance-enhancing properties made a difference in the bottom line of companies who put your widget to work on the assembly line.
That’s data storytelling at its best.
Your engineers and numbers people did their jobs. Now, it’s time to put all the data they generate to work through content that puts all that work into perspective.
The Elements of Data Storytelling: Beginning, Development, and Ending
After you’ve identified data that looks like a great brand story candidate, jot down the storyline that the data suggested: beginning, development, and ending.
Create a Rough Draft of the Storyline
If you’re visually oriented, use a storyboard to sketch out each part of the story. If you prefer writing, use a rough outline to guide your thinking.
Put notes in the margins. Include references to some of the preliminary data you’ve uncovered and links to where you can find that data.
Do Extensive Research to Support Your Storyline
- Look at your target audience: Start with the buyer persona(s) that will best benefit from the information in your story. Knowing their needs will guide you in your search for supplementary data that support your conclusion.
- Search for supporting data: Then, search online for both internal and external data that back up your preliminary conclusion. If you need extra research on some issues, task the proper teams to do original research to test your idea.
- Look for contradictory data: If you don’t know what the opposition might say, your story will go up on a puff of virtual smoke. Looking for contradictory data and discrediting it (be careful here lest you fall victim to the siren song of informal fallacies) is essential to proving your case. Arguing that just because 65% of all manufacturers choose your widget, other manufacturers should too, isn’t valid – it’s the appeal to the bandwagon fallacy. Instead, find out what kinds of gains that 65% realized by using your product.
Start Writing Your Story
Now that you’ve done the research and planning, it’s time to put it all together. Following a few simple steps will ensure that your story connects with the right people and coheres internally with both its facts and conclusions.
Sketch Out a Rough Draft of the Content
If your data holds true after you test it against contradictory data, it’s time to start building your story. Find a hook that will appeal to your target audience and write compelling copy that keeps them on the edge of the seat as they read.
Inject a healthy dose of empathy into your storyline. Not only does it enable you to see your audience’s problems with their eyes, but the data indicate that it’s good for business as well.
A 2020 Businessolver study showed a direct relationship between a business’s success and the empathy it demonstrated in its operations. Showing that you sympathize with your audience’s situation – so long as you solve the problem that gives rise to the situation – gives you an extra edge in obtaining their business.
Add Visuals to the Mix
Visuals do two things: They hold a reader’s attention and illustrate information in an easy-to-understand format. Choose infographics that illustrate your data, as well as images that evoke emotion in your readers, to reach both your left- and right-brained readers.
As Brain Rules’ John Medina points out, visuals help your audience remember more of the information in your content. When you hear information, you’ll only remember 10% of it three days afterward. If you show a visual along with the spoken word, they retain 65% of it.
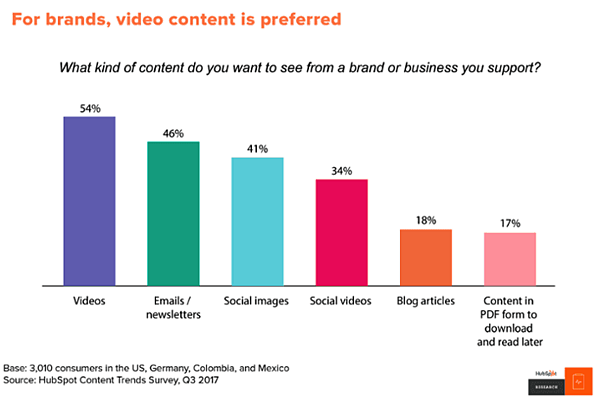
So, if you have a podcast, consider making it a video presentation. In longer blog posts, videos add visual pop and audience interest. As a HubSpot survey shows, 54% of the consumers they interviewed wanted to see more video content from the brands they follow.

And, if you’re posting a link to your content on Facebook or other social media (and you should), including an image will net you 2.3 times the engagement as a text-only post. Including full-color visuals in your blog posts themselves, too, will increase your readers’ desire to read through to the end by 80%.
That’s why it’s essential to add visual pop to your data storytelling, especially if your content is highly technical or a deep dive into a complex topic. Adding visual guideposts, such as headers, subheaders, and bullet points, helps people mentally organize what they read – even if they only skim it.
Flesh Out Your Content with a Convincing Argument and Supporting References
Now’s the time to fill in the gaps in your content with a well-reasoned argument. Use vivid language that will appeal to your target audience, but support your claims with a valid argument and authoritative references.
Filter Out the Noise
Eliminate wordy sentences. Cut out tangential arguments that deviate attention away from your main topic so that your brand story marches forward toward the ending, building up suspense as you go.
Proofread Your Work
Use Grammarly or another content checker to check your work for typos and grammatical errors. Get a second pair of eyes to look it over, if possible. There’s no substitute for a fresh perspective on one’s work.
Review Your Argument for Validity and Soundness
Double-check the facts you cite within your content. Then analyze your argument to make sure it contains no fallacies, formal or informal. Again, if you have an editor who can check your work for any logical missteps, we highly recommend a final check.
Sound reasoning distinguishes content marketing from mere advertising, where informal fallacies abound.
It’s the best of both worlds – reaching both reason and emotion with data-fueled brand stories. Crafting quality content that ticks off all those boxes takes a lot of work.
It’s well worth the effort, though. Its reach drives more engagement, more conversions, and ultimately, more revenue – as we’ve shown throughout this post.
But you don’t have to go it alone. If you are ready to get more traffic to your site with quality content published consistently, check out our Content Builder Service.
Set up a quick consultation, and I’ll send you a free PDF version of my books. Get started today – and generate more traffic and leads for your business.
The post Data Storytelling: The Path from Insights to Customer Success appeared first on Marketing Insider Group.
0 Commentaires